Raspberrypi and EC-5
Raspberrypi 3b+ 와 EC-5 센서를 활용한 토양수분 데이터 수집
Soil moisture data collecting using Raspberrypi3b and EC-5 sensor
이번 실험의 목적은 한국의 환경에 적합한 토양 수분 센서를 개발하는데 있다. EC-5 센서는 미국 Decagon 사(社)에서 개발한 토양 수분 센서로 고성능을 자랑한다. 하지만 우리나라의 환경에 맞게 개발 되지 않았으며 고가라는 점에서 국내 농가에서 사용하기에는 무리가 있다. 따라서 국내 환경에 적합하며 중저가인 토양 수분 센서를 개발하려고 한다. 이를 위해 본 실험에서는 국내에서 자체 개발된 센서와 EC-5 센서를 라즈베리파이 3b+ 모델에 연결하여 토양 수분 측정 데이터 비교한다. 그리고 이 데이터를 바탕으로 국내 제작 센서의 알고리즘을 개선하여 EC-5 수준으로 성능을 향상 시키려고 한다.
The purpose of this experiment is to develop soil moisture sensors that are suitable for Korea’s environment. The EC-5 sensor is a soil moisture sensor developed by Decagon, U.S. and boasts high performance. However, it has not been developed to suit the environment of Korea, and it is too expensive to use in domestic farms. Therefore, we are planning to develop soil water sensor that is suitable for domestic(Korea) environment and is inexpensive. To this end, this experiment connects the self-developed sensor and the EC-5 sensor in to the Raspberrypi 3b+ model and compares the soil moisture measurement data. Based on this data, we are going to improve algorithms of domestic fabrication sensors to improve performance to EC-5 levels.
Meter Group EC-5 Specifications
1. Raspberry pi
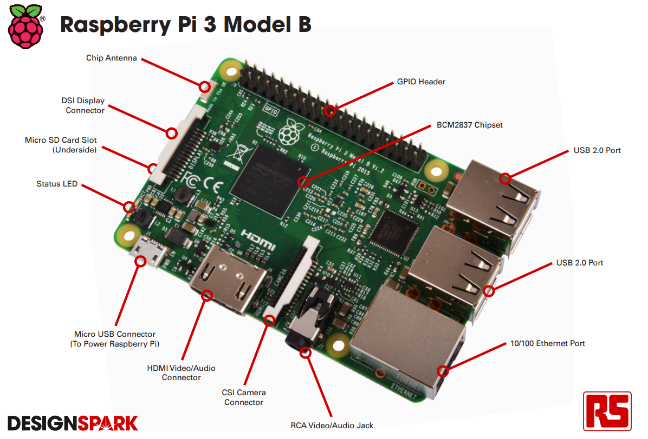
라즈베리파이(laspberry pi)는 영국 라즈베리파이재단이 학교와 개발도상국의 기초 컴퓨터 교육을 촉진하기 위해 개발한 신용카드 크기의 싱글보드 컴퓨터이다.(출처: 위키피디아) Raspberry Pi is a credit card-sized single-board computer developed by the Raspberry Pi Foundation in England to promote education in basic computer science in schools and developing countries.
라즈베리파이3의 기본 구조는 다음과 같다. Basic component of Raspberry pi3 is as below.
2. Raspberry pi 와 EC-5 연결하기
Connecting Raspberry pi and EC-5
EC-5는 전원(흰색), 접지, 신호(빨간색)용 케이블 3개로 구성되며, 각 라인은 라즈베리파이에서 적절한 GPIO 핀에 연결되어야 한다. 각 핀의 기능은 구글에서 검색 가능한 라즈베리파이 GPIO 핀 지도를 통해 쉽게 찾을 수 있다.
EC-5 consists of 3 cables for Power(white), Shield(braid) and Signal(red), and each line should be connected to appropriate GPIO(general-purpose input/output connection points) pins, on Raspberry pi. To find out each pins’ functions, you can easily find Raspberry pi’s GPIO pin map in google.
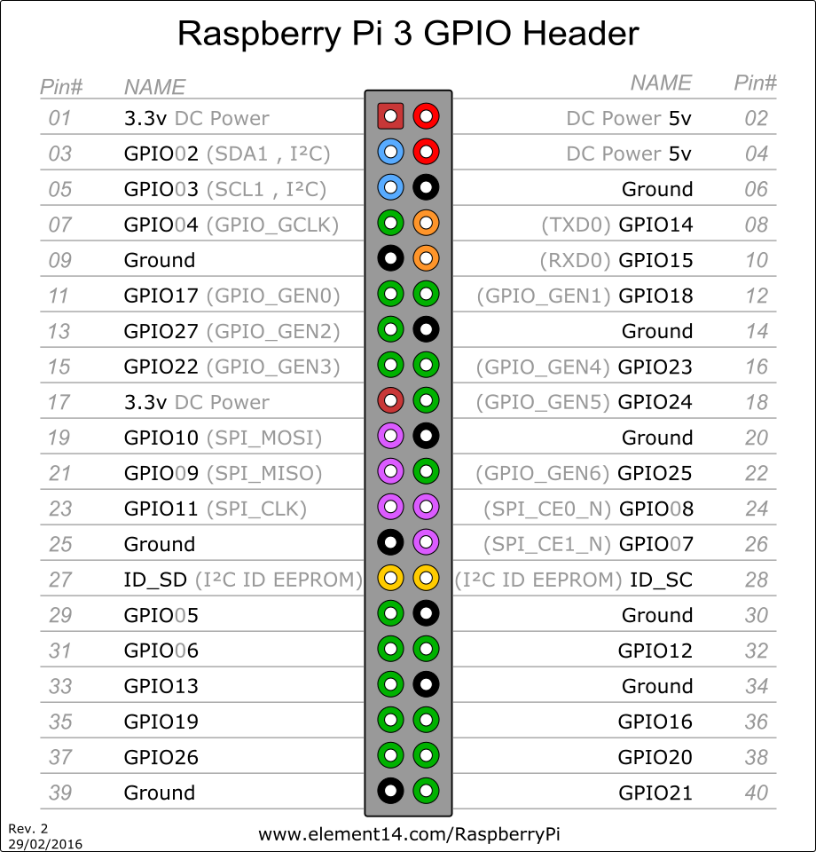
첫째, 전원과 접지선을 연결해야 한다. 필자는 17번 핀을 전원용으로 사용하고 39번 핀을 접지용으로 사용하였다. 특히 전원의 전압에 유념하여 해당 전압(3.3V 또는 5V)에 맞는 핀을 선택하여 한다.
First, you need to connect power and shield(or Ground) line. I used pin number 17 for power and pin number 39 for the Ground. Be aware of your power voltage and choose the right pin for your voltage(3.3V or 5V).
다음으로 신호선을 연결한다. 신호는 아날로그 방식이기 때문에 아날로그 신호를 디지털 방식으로 변환하는 컨버터가 필요하다.
Next, we need to connect the signal line. Since the signal is analog, a converter is needed to convert the analog signal to a digital one.
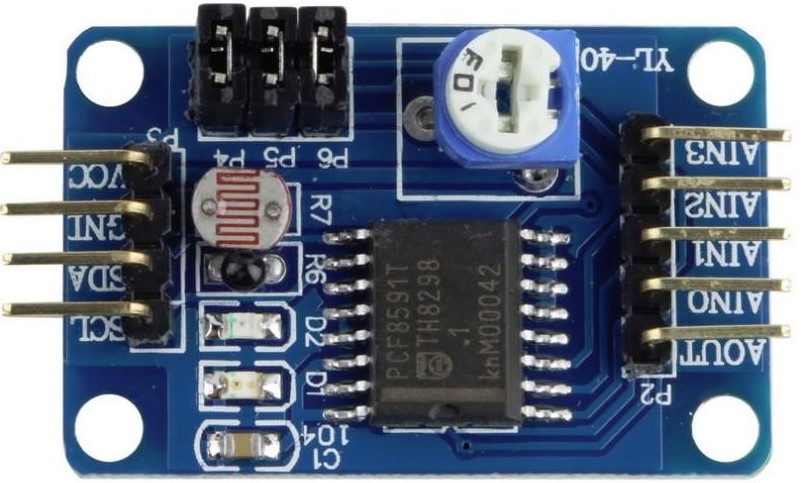
A/D converter YL-40
위 사진에서 볼 수 있듯이 우측에는 라즈베리파이 GPIO 핀에 연결되어야 하는 핀 4개가 있고 왼쪽에는 센서에서 신호 선을 연결하기 위한 핀 5개가 있다.
As you can see there are 4 pins on the right side which should be connected to Raspberry pi GPIO pins and 5 pins on the left side for connecting signal line from the sensor.
칩 우측의 SCL, SDA, GND 및 VCC의 각 핀을 적절한 GPIO 핀에 연결해야 하는데, GPIO 핀 지도 SDA에 따르면 SCL 핀은 각각 3번 핀과 5번 핀에 연결되어야 한다. VCC의 경우 다른 3.3V 전원 핀인 #17이 유일한 옵션이며 GND 핀의 경우 접지에 해당되는 아무 핀이나 사용하면 된다. 나의 경우에는 핀 6번을 사용하였다.
Each pins on the right side, SCL, SDA, GND and VCC, need to be connected to appropriate GPIO pins. According to the GPIO pin map SDA, SCL pin should be connected to pin #3 and #5 each. For VCC, the other 3.3V power pin #17 is the only option and for GND, any GND pins are ok. In my case I used pin #6.
왼편에서는 EC-5 센서의 신호 라인을 AIN0에서 AIN3으로 핀 중 하나에 연결해야 한다. 그러나 각 AIN 핀은 다른 범위의 전류를 보였다. 필자는 토양 수분 값의 정확한 값을 얻기 위해 가장 넓은 범위의 전류를 보여주는 AIN2 핀을 사용했다.(그러나 여전히 그 범위가 충분하지 않았기 때문에 전류의 범위를 넓히기 위해 전류를 증폭시키는 작업을 할 예정이다.)
Moving on to the left side, EC-5 sensor’s signal line should be connected to one of pins through AIN0 to AIN3. However, each AIN pins showed different range of electric current. To get a precise value of soil moisture value, I used AIN2 pin which showed widest range of current.(But still the range wasn’t enough, so we are working on amplifying current to widen the range.)
이제 회로가 준비되었다.
Now the circuit is ready!
3. Raspberry pi i2c bus 활성화 및 신호 주소 확인
Activating Raspberry pi i2c bus and Checking signal address
3.1. Raspberry pi i2c bus 활성화
Activate Raspberry pi i2c bus
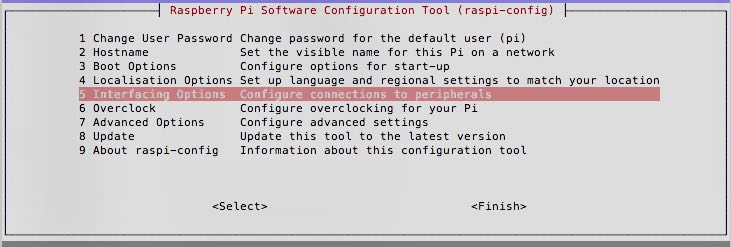
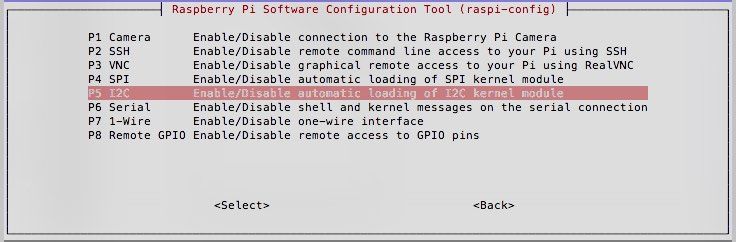
- 터미널을 열고 Raspbian configuration tool을 실행시킨다. Open a terminal and run the Raspbian configuration tool
sudo raspi-config- 5번 Interfacing option 선택.
Choose option(5) Interfacing Options
- P5 I2C를 선택해 yes를 눌러 I2C를 활성화 시킨다.
Then in the list the option (P5) I2C. Activate by selecting YES. No to disable.
- 터미널에서 raspberry pi를 재부팅한다.
It is necessary to restart the Raspberry Pi to take the change into account.
sudo reboot3.2. I2C 툴 설치
Install I2C tool
- 먼저 시스템을 업데이트 시킨다.
Make an update to the system
sudo apt update
sudo apt upgrade -y- 파이썬과 i2c 장치 간의 통신을 위한 툴(python-smbus)과 진단 툴(i2c-tools)을 설치한다.
Once the system is up-to-date, start the installation with the tools to communicate with i2c devices in Python (python-smbus) and diagnostic tools (i2c-tools).
sudo apt-get install -y python-smbus i2c-tools- I2C 모듈이 올바르게 설치 되었는지 확인할 수 있다.
Test whether the modules are fully loaded
lsmod | grep i2c_i2c_bcm2708 혹은 i2c_bcm2835 모듈이 확인되면 올바르게 설치된 것이다.
You need the module i2c_bcm2708 (or i2c_bcm2835 on the Raspberry Pi Zero W), is that the modules were loaded correctly.
3.3. i2cdetect를 이용한 센서 신호 주소 확인
Checking sensor signal address using i2cdetect
sudo i2cdetect -y 1센서가 올바르게 연결된 경우 위의 코드를 실행하면 아래와 같은 형태의 결과를 얻을 있다. 이때 48이 센서의 신호 주소이다.
If the sensor is well connected the code above will run as below. Here, 48 is the signal address.
pi@raspberrypi:~ $ sudo i2cdetect -y 1
     0  1  2  3  4  5  6  7  8  9  a  b  c  d  e  f
00:          -- -- -- -- -- -- -- -- -- -- -- -- --
10: -- -- -- -- -- -- -- -- -- -- -- -- -- -- -- --
20: -- -- -- -- -- -- -- -- -- -- -- -- -- -- -- --
30: -- -- -- -- -- -- -- -- -- -- -- -- -- -- -- --
40: -- -- -- -- -- -- -- -- 48 -- -- -- -- -- -- --
50: -- -- -- -- -- -- -- -- -- -- -- -- -- -- -- --
60: -- -- -- -- -- -- -- -- -- -- -- -- -- -- -- --
70: -- -- -- -- -- -- -- --
4. Python Code
bus 주소를 ‘address’ 변수에 넣고 input_addr 변수는 A/D 컨버터에서 사용하고 있는 핀에 따라 달라진다. AIN0 핀을 사용할 경우 input_addr은 0X40이고, AIN1의 경우 0X41이다. 필자는 AIN2 핀을 사용했기 때문에, input_addr 변수는 0X42이다.
Put the bus address in the ‘address’ variable. And input_addr variable depends on the pin you are using in the A/D converter. If you use AIN0 pin, input_addr will be 0X40 and in case of AIN1, 0X41 and so on. Since I used AIN2 pin, my input_addr variable is 0X42.
import smbus
import time
import sys
import pymysql
from sqlalchemy import create_engine
pymysql.install_as_MySQLdb()
import pandas as pd
from datetime import datetime

bus = smbus.SMBus(1)
address = 0x48

if len(sys.argv) == 2:
    i = int(sys.argv[1])
    input_addr = 0x42 + i
else:
    input_addr = 0x42

bus.write_byte(address, input_addr)
bus.read_byte(address)

while True:
    # time record
    t = datetime.now()
    tim = t.strftime("20%y/%m/%d-%H:%M")
    # value record
    bus.write_byte(address, input_addr)
    bus.read_byte(address)
5. R shiny를 활용한 대쉬보드 생성
Soil Moisture Data Dashboard using R shiny
library(dbConnect)
library(shinydashboard)
library(shiny)
library(dplyr)
library(tidyr)
library(ggplot2)
library(shinyTime)
library(lattice)

#get data fucntion
get_data <- function() {
  conn <- dbConnect(  RMySQL::MySQL(),  host = "host",  dbname = "soil_moisture",
                      user = "agdatalab_sensor",  password = "password")
  dbListTables(conn); dbGetQuery(conn, "set names 'euckr'")
  rs = dbSendQuery(conn, "SELECT * FROM soil_moisture_data")
  data = fetch(rs, n=-1)
  data_n1 <- data %>%
    separate(time, c('day', 'hour'), '-') %>%
    separate(day, c('year', 'month', 'day'), '/') %>%
    separate(hour, c('hr', 'min'), ':') %>%
    mutate(date = as.POSIXct(strptime(paste0(month, day, hr, min), "%m%d%H%M"))) %>%
    select(c(date, value))
  return(data_n1)
}

# dashboard
ui <- fluidPage(
  verticalLayout(
    titlePanel('Soil Moisture Data Dashboard'),
    fluidRow(
      column(3,
             dateRangeInput('dates', 'Date Range', start='2019-01-23'),
             fluidRow(
               column(4, h3('from:')),
               column(4, numericInput('min.hours', 'hours:', value=0)),
               column(4, numericInput('min.minutes', 'minutes:', value=0))
             ),
             fluidRow(
               column(4, h3('to:')),
               column(4, numericInput('max.hours', 'hours:', value=23)),
               column(4, numericInput('max.minutes', 'minutes:', value=59))
             )
      ),
      column(9,plotOutput('timeseries'))
    )
  )
)

# server
server <- function(input, output) {

  data <- get_data()

  data.filt <- reactive({
    mindate <- as.POSIXct(paste0(input$dates[1], as.character(input$min.hours),':', as.character(input$min.minutes)))
    maxdate <- as.POSIXct(paste0(input$dates[2], as.character(input$max.hours),':', as.character(input$max.minutes)))

    subset(data, date > mindate & date < maxdate)
  })

  output$timeseries <- renderPlot({
    ggplot(data.filt()) + geom_line(aes(x=date, y=value))
  })
}

# execution
shinyApp(ui, server)